MacAdam Ellipses: LED Color Impact
MacAdam ellipses are graphical regions on color charts that define the limits of human color perception. They show how much LED color variation people can detect under controlled viewing conditions.
Color consistency standards rely on these tolerance zones to ensure uniform appearance across multiple fixtures. This guide explains chromaticity tolerance zones and how they affect lighting quality in real installations.
Professional designers use these metrics to specify products that maintain visual harmony. Making informed choices prevents costly mismatches in commercial and residential projects.
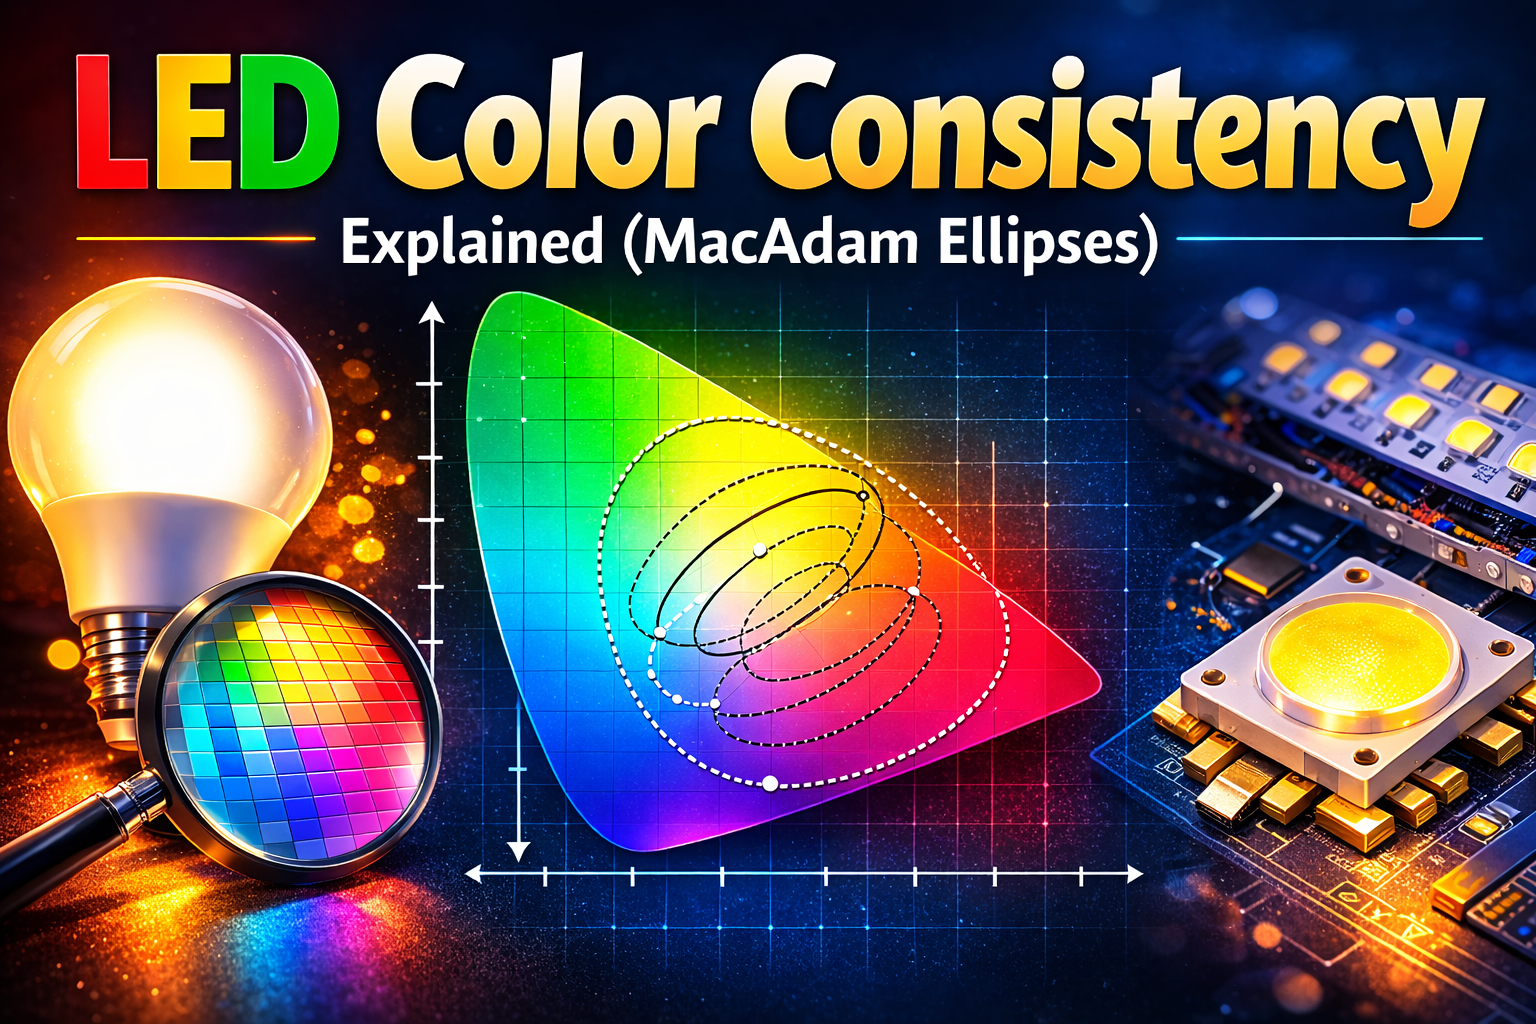
Table of Contents
What They Represent
These regions define zones where average observers cannot distinguish color differences. Each ellipse represents a boundary of just-noticeable difference in chromaticity. Points within the same ellipse appear identical under standard conditions.
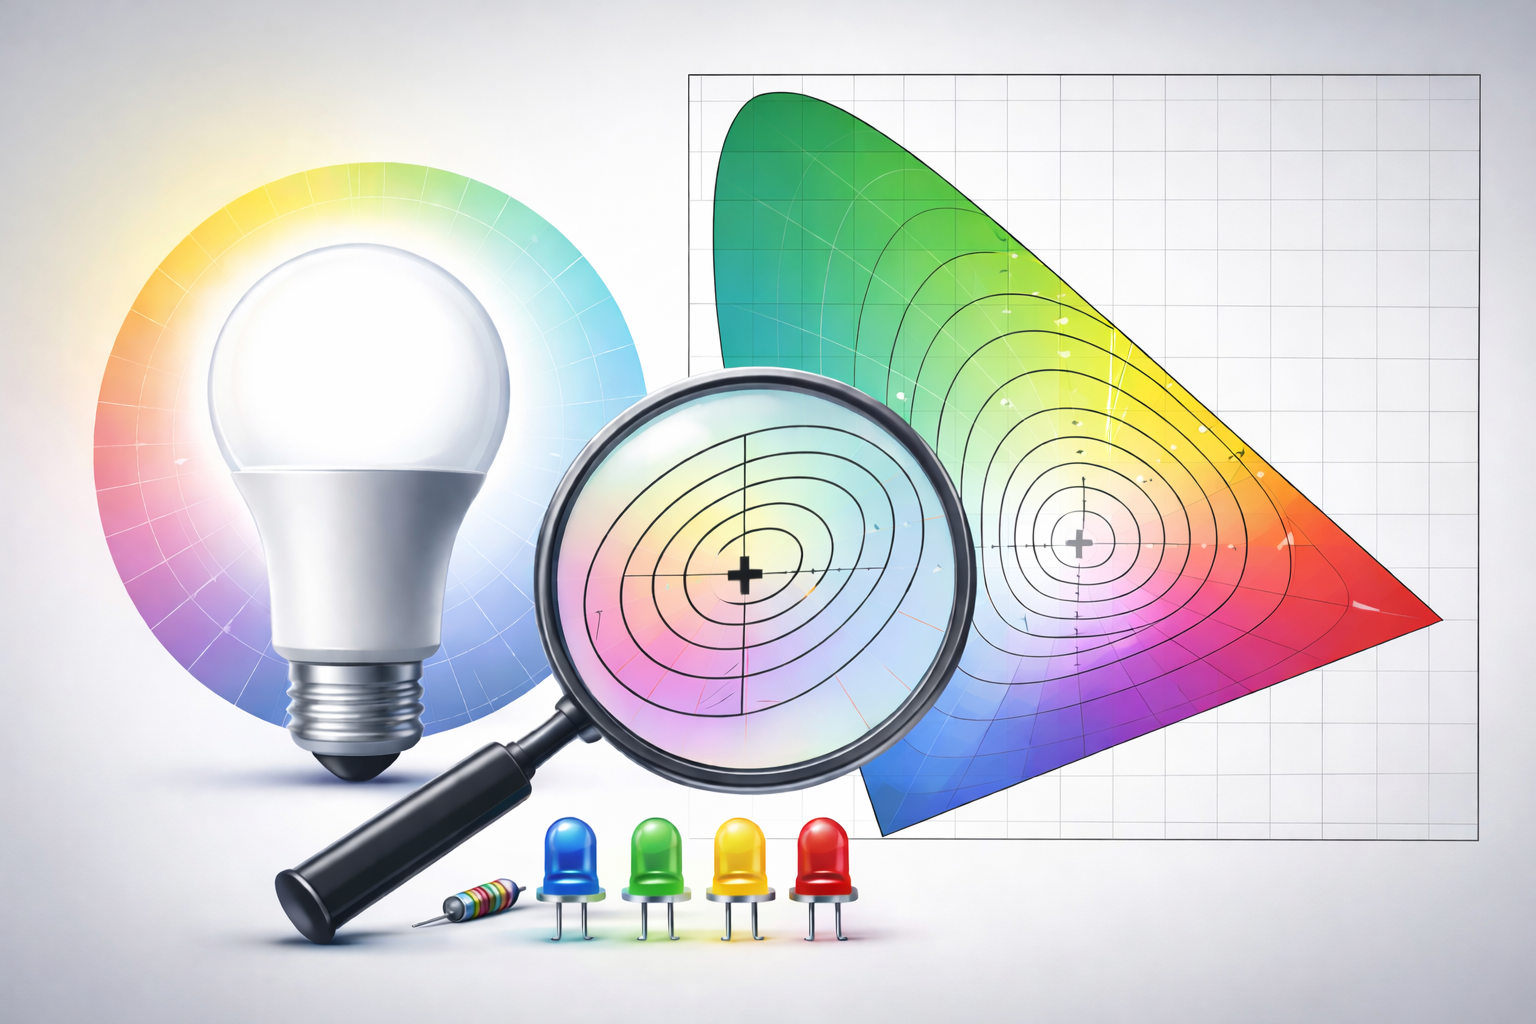
The CIE 1931 chromaticity diagram provides the coordinate system for plotting these zones. X and y axes represent color coordinates independent of brightness. MacAdam ellipses overlay this diagram showing perception thresholds across the visible spectrum.
Size and orientation vary by location on the chart. Human vision detects smaller shifts in some regions than others. Green areas show larger ellipses while blue regions feature smaller tolerance zones indicating heightened sensitivity.
Dimming control technologies explored in dimming control methods must maintain consistent chromaticity throughout intensity ranges.
Historical Development
David MacAdam conducted groundbreaking perception experiments in 1942. He asked observers to match colored lights repeatedly. Results mapped discrimination thresholds across the chromaticity diagram revealing non-uniform color consistency standards.
Original research tested 25 points covering the visible spectrum. Each location required multiple matching attempts by trained observers. Statistical analysis of matching errors produced the elliptical tolerance zones still used today.
If inconsistent color between fixtures is causing visible mismatches in your setup, using a reliable LED bulb with tight color consistency helps maintain uniform lighting and avoids noticeable variation across installations.
Later refinements expanded the dataset and improved mathematical models. Modern chromaticity tolerance zones build upon this foundational research. The ellipse concept remains the industry standard for quantifying LED color variation.
How They Work
Each ellipse defines a discrimination threshold centered on a target chromaticity. The boundary marks where 50% of observers detect visible difference. Points inside appear identical while points outside show detectable LED color variation.
Ellipse dimensions depend on viewing conditions including brightness, field size, and adaptation state. Standard measurements assume photopic vision with neutral background. Real-world conditions may alter perception thresholds affecting practical color consistency standards.
Mathematical formulas calculate ellipse boundaries from experimental data. Semi-major and semi-minor axes define shape and orientation. Rotation angle varies by location reflecting the non-uniform nature of human color perception.
Multiple ellipses can be drawn around any point. One-step MacAdam ellipses represent just-noticeable differences. Larger multiples define increasingly obvious chromaticity tolerance zones for different quality tiers. To understand the underlying technology, see how LED lighting works.
Step Classifications
Industry specifications typically reference ellipse multiples rather than absolute sizes. The following table compares common step classifications used in LED manufacturing and quality control.
| Step Size | Visibility | Typical Application |
|---|---|---|
| 1-step | Barely noticeable | Premium grade |
| 2-3 step | Subtle difference | Commercial standard |
| 4-5 step | Clearly visible | Budget products |
| 7+ step | Obviously different | Unacceptable variation |
Premium architectural lighting specifies 1-step tolerances ensuring imperceptible variation. Most commercial products use 3-step MacAdam ellipses balancing cost and quality. Budget options may exceed 5-step showing obvious LED color variation.
Smaller step numbers indicate tighter control and higher manufacturing costs. Selecting appropriate tolerances depends on application sensitivity. Museums require stricter limits than warehouses prioritizing basic illumination.
Understanding lighting efficiency metrics also helps evaluate performance alongside color consistency.
Industry Standards
ANSI C78.377 defines standard chromaticity tolerance zones for white LEDs. Quadrangles on the chromaticity diagram specify acceptable ranges for different color temperatures. These zones approximate multi-step MacAdam ellipses simplified for manufacturing control.
ENERGY STAR specifications reference these standard bins ensuring minimum quality levels. Products must fall within designated quadrangles to earn certification. Tighter tolerances distinguish premium products from basic offerings in competitive markets.
IES TM-30 provides comprehensive color consistency standards beyond simple chromaticity. Fidelity and gamut metrics complement traditional measures. Complete evaluation requires multiple parameters ensuring quality color rendering alongside tight chromaticity tolerance zones.
Regulatory Requirements
California Title 24 mandates maximum chromaticity deviations for commercial installations. Products must meet specified tolerances ensuring uniform appearance. Compliance requires third-party testing validating color consistency standards.
Federal purchasing specifications often require 3-step or tighter MacAdam ellipses. Government projects demand proven quality control. Manufacturers must demonstrate capability through statistical process control and batch testing.
LED Manufacturing
Semiconductor fabrication produces natural variation in LED output chromaticity. Wafer position, temperature gradients, and material composition affect final color. No two chips emerge identical requiring sophisticated sorting to achieve tight chromaticity tolerance zones.
Phosphor application introduces additional variability in white LEDs. Coating thickness and uniformity affect color temperature. Premium manufacturers invest heavily in process control minimizing LED color variation throughout production runs. Learn more about LED chip variations that influence these differences.
Statistical process control monitors production batches identifying trends before specifications drift. Real-time measurement enables immediate corrections. Tight manufacturing control reduces bin width improving yield within target MacAdam ellipses.
Reference ENERGY STAR guide to LED lighting basics for quality certification requirements and testing protocols.
Binning Process
Every LED undergoes optical testing measuring chromaticity coordinates. Automated equipment sorts chips into bins matching target specifications. Bin boundaries correspond to MacAdam ellipses or ANSI quadrangles ensuring consistent color consistency standards. This is known as the LED binning process.
Tighter bins command premium pricing reflecting lower yields. One-step tolerance requires rejecting more production output. Manufacturers balance market demands against economic realities when establishing bin structures.
Multiple bins cover the full production range. Center bins meet nominal specifications while edge bins serve less demanding applications. Smart purchasing matches bin tightness to actual project requirements avoiding unnecessary costs.
Bin Mixing
Mixing different bins in the same installation causes visible mismatches. Adjacent fixtures from separate bins show LED color variation even within specification. Professional installations source complete quantities from single production batches preventing chromaticity tolerance zone conflicts.
Replacement lamps pose particular challenges over time. Original bins may become unavailable requiring substitutions. Specifying tighter initial tolerances provides margin accommodating future replacements within acceptable MacAdam ellipses.
Practical Implications
Visible color differences frustrate end users even when products meet specifications. Three-step MacAdam ellipses become noticeable in direct comparison. Critical applications demand one-step or two-step tolerances preventing customer complaints.
Viewing distance affects perception thresholds. Close inspection reveals differences invisible from normal viewing positions. Designers must consider actual installation geometry when specifying chromaticity tolerance zones for LED color variation.
Surrounding context influences color perception through simultaneous contrast effects. Identical chromaticities appear different against varying backgrounds. Complete lighting designs account for these psychophysical phenomena beyond simple color consistency standards.
Lumen maintenance over time adds another dimension. LEDs may shift chromaticity as they age. Initial tight tolerances provide headroom accommodating gradual drift throughout operational life maintaining acceptable performance. See how color shift over time affects long-term results.
Specification Guidance
Retail environments benefit from 2-step MacAdam ellipses ensuring merchandise appears consistent. Hotels and hospitality require similar precision maintaining ambiance across spaces. These applications justify premium products with tight chromaticity tolerance zones.
Office lighting tolerates 3-step specifications balancing cost and quality. Warehouses and industrial facilities accept 4-step or looser depending on task requirements. Matching tolerance to application prevents overspending without compromising functional performance. For workspace setups, consider best bulbs for workspaces.
Outdoor applications face less stringent demands. Large fixtures viewed from distance mask color differences. Practical specifications relax tolerances while maintaining adequate LED color variation control for public safety.
Additional resources available at comprehensive LED technical knowledge hub provide detailed specification guidance for various application types.
Documentation Requirements
Manufacturers should provide complete spectral data and chromaticity coordinates. Documentation must specify measurement conditions and bin boundaries. Transparency enables informed selection matching products to project color consistency standards.
Test reports from accredited laboratories validate manufacturer claims. Third-party verification builds confidence especially for critical installations. Requesting documentation before purchase prevents expensive mistakes discovered after installation.
Testing Methods
Spectroradiometers measure LED emission spectra calculating chromaticity coordinates. Calibrated instruments ensure measurement accuracy within narrow tolerances. Regular calibration maintains traceability to national standards supporting reliable quality control.
Goniophotometric testing captures angular distribution affecting perceived color. LEDs exhibit chromaticity shifts with viewing angle. Complete characterization requires measurements across emission patterns ensuring compliance throughout the beam.
Temperature affects LED chromaticity requiring controlled test conditions. Measurements at 25°C may not reflect actual operating performance. Sophisticated testing protocols evaluate color stability across operating temperature ranges predicting real-world behavior.
Accelerated aging tests project long-term chromaticity stability. Elevated temperature operation reveals degradation mechanisms. Reliable predictions require months of testing but provide confidence in sustained color consistency standards throughout rated lifetime.
Common Problems
Mixed production batches cause most color matching failures. Fixtures from different manufacturing runs exhibit visible variation. Large projects require advance planning securing sufficient inventory from single batch production maintaining tight MacAdam ellipses.
Temperature differences across installations shift individual fixture chromaticity. Poor thermal management creates LED color variation within supposedly matched products. Proper cooling maintains stable performance preventing drift outside specification chromaticity tolerance zones.
Driver compatibility affects output stability. Mismatched drivers cause current fluctuations shifting chromaticity. Complete system validation ensures components work together maintaining color consistency standards throughout dimming ranges and power conditions.
Replacement lamps from different manufacturers rarely match originals. Even identical specifications use different bins. Maintaining spare inventory from original purchase ensures future replacements maintain installation uniformity within acceptable MacAdam ellipse tolerances.
Sharing this guide
If you found this guide helpful, you can save it for later or share it with a friend. It’s especially useful for beginners, homeowners, and DIY users.
Share using the links below
Interested in learning more? Browse all related articles in our category section.
Pingback: LED Lifespan Testing: Critical Guide Today - NeoLEDHub
Pingback: LED Binning Explained: What It Means - NeoLEDHub